- 2.8.4.1. Special approach for on-road mobile MOVES SCCs
- 2.8.4.2. Fuel types in MOVES
- 2.8.4.3. MOVES Vehicle Types
- 2.8.4.4. MOVES Road Types
- 2.8.4.5. MOVES Process Types
- 2.8.4.6. Representative Counties
- 2.8.4.7. Reference Fuel month
- 2.8.4.8. Meteorological Data Processing
- 2.8.4.9. MOVES Emission Processes by Emission Rate Tables
- 2.8.4.10. MOVES Pollutant Groups
SMOKE provides two ways of processing mobile sources using MOVES. (Recall that by “mobile sources” in SMOKE we mean on-road mobile sources.) The first approach is to compute mobile emissions values prior to running SMOKE and provide them to SMOKE as input; we call this the precomputed-emissions approach. The second approach is to provide SMOKE with VMT data, Vehicle population (VPOP) data, meteorology data, and MOVES outputs, and have SMOKE compute the mobile emissions based on these data; this is called the MOVES approach. These approaches are not mutually exclusive, so it is possible to provide both precomputed emissions and VMT and VPOP data to SMOKE and have the system compute only some of the emissions using MOVES outputs. Both processing approaches can produce criteria, particulate, and toxics emissions results.
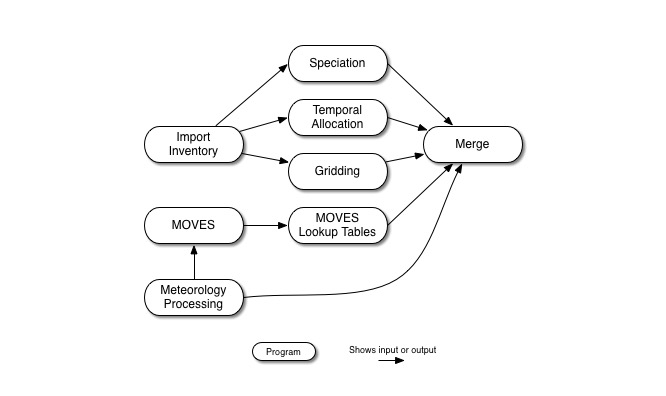
The precomputed-emissions approach is quite similar to the processing method for area sources. In fact, Figure 2.8, “Base case area-source processing steps”, Figure 2.9, “Future- or past-year growth and optional control area-processing steps”, and Figure 2.10, “Alternative future- or past-year growth and control area-processing steps” from Section 2.8.2, “Area-source processing” show exactly the processing steps needed for processing mobile sources using SMOKE and the precomputed-emissions approach. As in base-case processing for area sources, emissions in the inventory file are subdivided to hourly emissions during temporal allocation, assigned chemical speciation factors during speciation, and assigned spatial allocation factors during gridding. The merge step combines the hourly emissions, speciation matrix, and gridding matrix to create model-ready emissions. For future- or past-year processing, the growth and controls step is added to create the growth and control matrices, while the grow inventory step converts the inventory from the base year to a future or past year. The control matrix can be optionally used in the merge step to apply control factors to the future- or past-year emissions. Note that, unlike the VMT approach, in the precomputed-emissions approach SMOKE will not model the variations in emissions caused by temperature, humidity, or other meteorological settings.
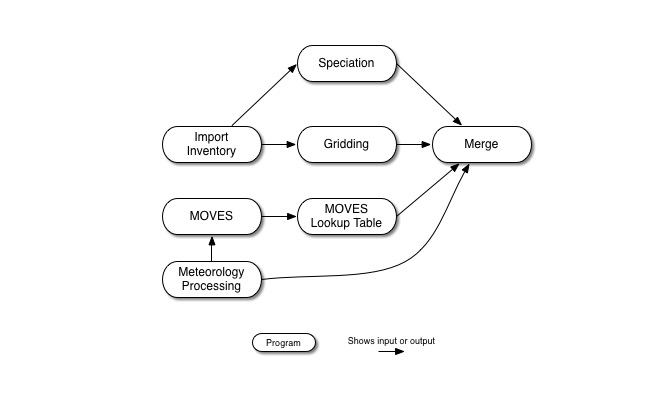
The MOVES approach is much different from the precomputed-emissions approach. Figure 2.13, “MOVES mobile RatePerDistance processing steps” and Figure 2.14, “MOVES mobile RatePerVehicle and RatPereProfile (off-network) processing steps” summarize the MOVES approach. First, county total activity inventory VMT data by road class and vehicle type or county total activity inventory VPOP by vehicle type are input to SMOKE. The chemical speciation step computes the chemical speciation factors for each county, road class, vehicle type, emissions process (e.g., exhaust start, exhaust running, evaporative processes, extended idle, and crankcase), and pollutant and stores the necessary factors for this transformation. The gridding step allocates the sources to grid cells and uses spatial surrogates to allocate county-total emissions to grid cells, storing the emission rates needed for these allocations based on hourly gridded ambient temperature meteorology.
The approach for running MOVES for SMOKE relies on the concept of representative counties and fuel months. The concept of representative county refers to running MOVES for a single county, which is the representative county, to represent itself and other counties that share the same MOVES input parameters and thus have the same emission rates for any given speed, temperature and humidity. A reference fuel month similarly refers to a reference fuel month's MOVES run that contains the temperatures that occur in neighboring months as well as the representative month. The mapping of calendar months to a representative month should be assigned on the basis of shared fuel parameters, because it is the interaction of fuel and temperature that is important. For example, an average-hourly temperature of 70°F may occur in some hour of any day in each of four months: May, June, July and August. If those four months share the same fuel properties (i.e. summer fuel) then an emission factor will be determined for just the representative month, reducing by a factor of four the number of calculations that MOVES needs to perform.
Unlike MOBILE6, MOVES differentiates between on-roadway emission processes and off-network emission processes. Figure 2.13, “MOVES mobile RatePerDistance processing steps” summarizes the approach used by MOVES for on-roadway mobile sources. The on-roadway emission process includes county-total VMT and average speed inventory as input. The off-network emission processes use the county-total vehicle population by vehicle type as input. Figure 2.14, “MOVES mobile RatePerVehicle and RatPereProfile (off-network) processing steps” summarizes the approach used by MOVES for off-network mobile sources. Both on-roadway and off-network emission processes do require real gridded meteorology data from MCIP files to estimate temperature-dependent emission rates.
In sections later in this chapter, we describe the SMOKE programs that are needed for each of the processing steps just described for MOVES processed mobile sources, and additional details about what activities are accomplished during each step. These sections are:
Processing mobile sources involves a number of concepts that are unique to mobile sources. These include a special classification of road types in MOVES, SMOKE and MOVES vehicle types, emissions processes, MOVES emission factors, representative counties, reference fuel months, and meteorological processing using Met4moves. The following subsections explain these topics in more detail.
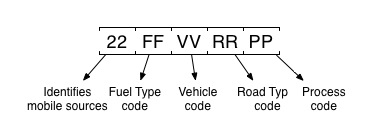
SMOKE handles SCCs differently for on-road mobile sources compared with all other source categories. SMOKE programs assume that on-road mobile SCCs have the following form:
MOVES can model six different fuel types: Gasoline, Diesel, Compressed Natural Gas (CNG), Liquefied Petroleum Gas (LPG), Ethanol, and Electricity. Table 2.2, “MOVES Fuel Type” indicates a list of original MOVES fule types. Table 2.3, “Example of aggregated fuel types and corresponding MOVES fuel types” shows how the four aggregated SCC fuel types are mapped to the six MOVES fuel types.
Table 2.2. MOVES Fuel Type
| MOVES Fuel Type | Description |
|---|---|
| 01 | Gasoline |
| 02 | Diesel |
| 03 | Compressed Natural Gas (CNG) |
| 04 | Liquefied Petroleum Gas (LPG) |
| 05 | Ethanol (E-85) |
| 09 | Electricity |
Table 2.3. Example of aggregated fuel types and corresponding MOVES fuel types
| SCC | Example of aggregated Fuel Type Description | MOVES Fuel Type |
|---|---|---|
| x1 | All non-diesel fuels | 01; 03; 04; 05; 09 |
| x2 | All gasoline and ethanol blends | 01; 05 |
| x3 | All fossil fuels | 01; 02; 03; 04; 05 |
| 00 | All fuels | 01; 02; 03; 04; 05; 09 |
The vehicle types used in SMOKE’s on-road mobile source processing are described in Table 2.4, “MOVES Vehicle type codes and descriptions”. Table 2.5, “Example of aggregated vehicle types and corresponding MOVES vehicle types” shows how the eight aggregated MOVES vehicle types are mapped to the original MOVES vehicle types.
Table 2.4. MOVES Vehicle type codes and descriptions
| MOVES Vehicle Type | Description |
|---|---|
| 11 | Motorcycle |
| 21 | Passenger Car |
| 31 | Passenger Truck |
| 32 | Light Commercial Truck |
| 41 | Intercity Bus |
| 42 | Transit Bus |
| 43 | School Bus |
| 51 | Refuse Truck |
| 52 | Single Unit Short-haul Truck |
| 53 | Single Unit Long-haul Truck |
| 54 | Motor Home |
| 61 | Combination Short-haul Truck |
| 62 | Combination Long-haul Truck |
Table 2.5. Example of aggregated vehicle types and corresponding MOVES vehicle types
| SCC | Example of aggregated Vehicle Type Description | MOVES Vehicle Type |
|---|---|---|
| 30 | Light Duty Trucks | 31; 32 |
| 40 | Buses | 41; 42; 43 |
| 70 | All Heavy Duty Trucks and Buses | 41; 42; 43; 51; 52; 53; 54; 61; 62 |
| 71 | All Heavy Duty Trucks | 51; 52; 53; 54; 61; 62 |
| 72 | All Combination Trucks | 61; 62 |
| 80 | All Trucks and Buses | 31; 32; 41; 42; 43; 51; 52; 53; 54; 61; 62 |
| 81 | All Trucks except Buses | 31; 32; 51; 52; 53; 54; 61; 62 |
| 00 | All Vehicles | 11; 21; 31; 32; 41; 42; 43; 51; 52; 53; 54; 61; 62 |
MOVES can produce emission factors for possible combinations between 13 MOVES vehicle types and fuel types. For the efficiency of SMOKE processing, the emission factors can be aggregated to a list of vehicle types listed in Table 2.5, “Example of aggregated vehicle types and corresponding MOVES vehicle types”.
MOVES can model nine different road types: rural restricted/unrestricted access with ramps, rural restricted/unrestricted access without ramps, urban restricted/unrestricted access with ramps, urban restricted/unrestricted access without ramps, and off-network (Table 2.6, “Road class and corresponding MOVES road type”). Table 2.7, “Example of aggregated road types and corresponding MOVES road types” indicates how the 6 aggregated MOVES road classes are mapped to the nine MOVES road types.
Table 2.6. Road class and corresponding MOVES road type
| MOVES Road Type | Description |
|---|---|
| 01 | Off-Network |
| 02 | Rural Restricted Access |
| 03 | Rural Unrestricted Access |
| 04 | Urban Restricted Access |
| 05 | Urban Unrestricted Access |
| 06 | Rural Restricted without Ramps |
| 07 | Urban Restricted without Ramps |
| 08 | Rural Restricted only Ramps |
| 09 | Urban Restricted only Ramps |
MOVES can model 14 different process types: including on-roadway and off-network emissions processes, for the selected pollutants. Off-network emission processes (e.g., parked engine-off, engine starts, and idling, and fuel vapor venting in MOVES (Table 2.8, “Process types and corresponding MOVES road type”). Table 2.9, “Example of aggregated process types and corresponding MOVES process types” indicates how the 14 aggregated MOVES process types are mapped to the 14 MOVES process types.
Table 2.8. Process types and corresponding MOVES road type
| MOVES Process | Description |
|---|---|
| 01 | Running Exhaust |
| 02 | Start Exhaust |
| 09 | Brakewear |
| 10 | Tirewear |
| 11 | Evaporative Permeation |
| 12 | Evaporative Fuel Vapor Venting |
| 13 | Evaporative Fuel Leaks |
| 15 | Crankcase Running Exhaust |
| 16 | Crankcase Start Exhaust |
| 17 | Crankcase Extended Idle Exhaust |
| 18 | Refueling Displacement Vapor Loss |
| 19 | Refueling Spillage Loss |
| 90 | Extended Idle Exhaust |
| 91 | Auxiliary Power Exhaust |
| 99 | Well-to-Pum>Well-to-Pumpp |
Table 2.9. Example of aggregated process types and corresponding MOVES process types
| SCC | Example of aggregated Process Type Description | MOVES Process Type |
|---|---|---|
| 50 | All Exhaust | 1; 2; 15; 16; 17; 90; 91 |
| 51 | All Exhaust except Hotelling | 1; 2; 15; 16 |
| 52 | All hotelling exhaust | 17; 90; 91 |
| 53 | All Extended Idle Exhaust | 17; 90 |
| 60 | All Evaporative and Refueling | 11; 12; 13; 18; 19 |
| 61 | All Evaporative except Refueling | 11; 12; 13 |
| 61 | All Evaporative except Refueling | 11; 12; 13 |
| 62 | All Refueling | 18; 19 |
| 63 | All Evaporative except Permeation and Refueling | 12; 13 |
| 70 | All Exhaust and Evaporative and Refueling | 1; 2; 11; 12; 13; 15; 16; 17; 18; 19; 90; 91 |
| 71 | All Exhaust and Evaporative except Refueling | 1; 2; 11; 12; 13; 15; 16; 17; 90; 91 |
| 72 | All Exhaust and Evaporative except Refueling and Hotelling | 1; 2; 11; 12; 13; 15; 16 |
| 80 | All Exhaust and Evaporative and Brake and Tire Wear except Refueling | 1; 2; 9; 10; 11; 12; 13; 15; 16; 17; 90; 91 |
| 81 | All Exhaust and Evaporative and Brake and Tire Wear except Refueling and Hotelling | 1; 2; 9; 10; 11; 12; 13; 15; 16; 17 |
| 00 | All Processes | 1; 2; 9; 10; 11; 12; 13; 15; 16; 17; 18; 19; 90; 91 |
The approach for running MOVES for SMOKE relies on the concept of representative counties. These are counties that are used during the creation and use of emission rates to represent a set of similar counties (i.e., inventory counties) called a county group. The purpose of the representative county approach is to reduce the computational burden of running MOVES on every county in your modeling domain. By using a represenative county, the user generates key emission rates for the single county in MOVES and then utilizes these factors to estimate emissions for all counties in the county group through SMOKE. The representative county is modeled at a range of speeds and temperatures to produce emission rate lookup tables (grams/mile or grams/vehicle/hour, depending on mobile emission process). The variables that are assumed to be constant across the county group members (and the representative county) are fuel parameters, fleet age distribution and inspection/maintenance (I/M) programs. The variables that can vary within the county group are vehicle miles traveled (VMT), source type vehicle population, roadway speed, and grid cell temperatures. Determining the representative counties and their respective county groups is a key aspect of utilizing the SMOKE-MOVES tool. It is ideal for the user to create each county group based on the similarity between the county characteristics (e.g., urban and rural) and the meteorological conditions (e.g., temperature and relative humidity). The user should avoid grouping counties that have significantly different meteorological conditions.
Along with the concept of representative county approach, the concept of a fuel month is very important. It is used to indicate when a particular set of fuel properties should be used in a MOVES simulation. Similar to the representative county, the fuel month reduces the computational time of MOVES by using a single month to represent a set of months. To determine the fuel month and which months it corresponds to, the user should review the State-provided fuel supply data in the MOVES database for each representative county. If the fuel supply data change throughout the year, then group the months by fuel parameters. For example, if the grams/mile exhaust emission rates in January are identical to February's rates for a given representative county, then use a single fuel month to represent January and February. In other words, only one of the months needs to be modeled through MOVES.
The meteorological data processor program Met4moves prepares spatially and temporally averaged temperatures and relative humidity data to set up the meteorological input conditions for MOVES and SMOKE using the Meteorology-Chemistry Interface Processor (MCIP) output files.
Met4moves must be run after MCIP and before the MOVES Driver script “Runspec_generator.pl” and SMOKE modeling system.
The following are the major processing steps that Met4moves performs:
-
Read the representative county cross-reference file
MCXREFthat contains a list of representative counties and the county groups that map to those representative counties. -
Read the surrogate description file
SRGDESCand a list of associated spatial surrogate(s) chosen for use in selecting grid cells. -
Determine a list of grid cells for each county. Only the selected grid cells are used to estimate the min/max temperatures, 24-hour temperature profiles, and RH over the user-specified modeling period.
-
Set the dates of the modeling episode in local time using the flags
STDATEandENDATE -
Determine the fuel month for the representative county using the
MFMREFinput file. -
Read the country/state/county
COSTCYorGEOCODE_LEVEL[1-4](if USE_EXP_GEOCODES Y) file to define the time zones for county groups. -
Read the meteorology data that have been processed by MCIP.
-
Calculate the min/max temperatures hourly and over the modeling period.
-
Calculate average RH for the specified hour range over the modeling period.
-
Once min/max temperatures and averaged RH are estimated for all representative counties and all inventory counties in the county groups, estimate diurnal 24-hour temperature profiles for use by the MOVES Driver script. The result is a normalized 24-hour shape profile over the user-specified period or fuel month.
When the MOVES model runs for SMOKE, it runs for all emissions processes (or modes), including on-roadway and off-network emissions processes, for the selected pollutants. Off-network emission processes (e.g., parked engine-off, engine starts, and idling, and fuel vapor venting) in MOVES are hour-dependent due to vehicle activity assumptions built into the MOVES model; the emission rate depends on both hour of the day and temperature. On-roadway emission processes (e.g., running exhaust, crankcase running exhaust, brake wear, tire wear, and on-road evaporative), on the other hand, do not depend on hour. In MOVES, these emission processes are categorized into three major groups:
- RatePerDistance (RPD) - The emission rate of on-roadway vehicles (i.e., driving) from MOVES. The rate is expressed in grams/mile traveled.
- RatePerVehicle (RPV) - The emission rate of vehicles off-network (e.g., idling, starts, refueling, parked) from MOVES. The rate is given in grams/vehicle/hour.
- RatePerProfile (RPP) - The emission rate of vehicles off-network specifically, the evaporation from parked vehicles (vapor-venting emissions) from MOVES. The rate is expressed in grams/vehicle/hour.
- RatePerHour (RPH) - The emission rate of extended idle exhaust from on-roadway vehicle. The rate is expressed in grams/hour traveled.
MOVES emission rates are organized into four lookup tables (RPD, RPV, RPP, RPH), depending on emission process and whether the vehicle is parked or in motion. The approach to running MOVES for SMOKE is unique for each emission rate table listed in Table 2.10, “MOVES Emission Processes by Emission Rate Tables”. A complete inventory must use the emission rates from all three tables. Note that refueling emission process is not a subject to MOVES emission rate table approach yet.
Table 2.10. MOVES Emission Processes by Emission Rate Tables
| MOVES Lookup Table | Units | Emissions Process | |||||||
|---|---|---|---|---|---|---|---|---|---|
| RatePerDistance (RPD) | Grams/mile |
|
|||||||
| RatePerVehicle (RPV) | Grams/vehicle/hour |
|
|||||||
| RatePerProfile (RPP) | Grams/vehicle/hour | Off-network Evaporative Fuel Vapor Venting | |||||||
| RatePerHour (RPH) | Grams/hour | On-roadway Extended Idle Exhaust |
The RPD lookup table is used to provide estimates of on-roadway emissions processes from mobile sources, using a separate file for each representative county. The on-road running processes that appear in this table include running exhaust, crankcase running exhaust, brake wear, tire wear, on-road evaporative permeation, on-road evaporative fuel leaks, and on-road evaporative vapor venting. The units of the emission rates in this table are grams/mile. The lookup fields for the factors are temperature and average speed. There are 16 set speed bins defined in Table 2.11, “MOVES Default Speed Bins” (i.e., avgSpeedBinID 1=2.5mph, 2=5mph, 3=10mph, …16=75mph). The avgBinSpeed is used for interpolation in the RPD table.
The RPV lookup table is used to provide estimates of off-network emission processes (parked engine-off, engine starts, and idling), except for the evaporative off-network vapor venting emissions process. A separate file is provided for each representative county. The off-network emission processes include start exhaust, crankcase start exhaust, off-network evaporative permeation, off-network evaporative fuel leaks, extended idle exhaust, and crankcase extended idle exhaust. Fuel month, temperature, and local hour are the lookup fields in this table, and hours are in the local time of the modeling county. The units of the emission rates are grams/vehicle/hour. Note: Although the units are grams/vehicle/hour, the number of vehicles (i.e., population) should not be temporally allocated to hours in SMOKE. Instead, a county total of vehicle population should be multiplied by emission rates at any given hour. The number of starts per vehicle by hour is already accounted for in the MOVES lookup table.
The RPP table is used only to estimate emissions for off-network fuel vapor venting when the vehicle is parked. This process type includes diurnal (when the vehicle is parked during the day) and hot soak (immediately after a trip when the vehicle parks) emissions types. The process depends on the rate of rise in temperature and the maximum temperature achieved during the day for the diurnal emissions type, and on the hourly temperatures for the hot soak emission type. The lookup fields for this table are reference fuel month and hour of day. As with the RPV table, the units of the emission rates are grams/vehicle/hour. The estimated emissions rates need to be multiplied by the county vehicle population. The representative county lookup tables contain 24-hour emission rates per hour per vehicle using a representative county temperature profile with different minimum and maximum temperatures. The average day county emissions are determined by interpolating between the minimum and maximum temperatures for the modeling county generated by Met4moves. Section 2.8.4.8, “Meteorological Data Processing” summarizes how Met4moves processes meteorological data for both MOVES and SMOKE.
The RPH table is used only to estimate emissions for on-roadway extended idle exhaust process from mobile sources, using a separate file for each representative county.
Table 2.11. MOVES Default Speed Bins
| avgSpeedBinId | avgBinSpeed | AvgSpeedBinDesc |
|---|---|---|
| 1 | 2.5 | speed < 2.5mph |
| 2 | 5 | 2.5mph ≤ speed < 7.5mph |
| 3 | 10 | 7.5mph ≤ speed < 12.5mph |
| 4 | 15 | 12.5mph ≤ speed < 17.5mph |
| 5 | 20 | 17.5mph ≤ speed < 22.5mph |
| 6 | 25 | 22.5mph ≤ speed < 27.5mph |
| 7 | 30 | 27.5mph ≤ speed < 32.5mph |
| 8 | 35 | 32.5mph ≤ speed < 37.5mph |
| 9 | 40 | 37.5mph ≤ speed < 42.5mph |
| 10 | 45 | 42.5mph ≤ speed < 47.5mph |
| 11 | 50 | 47.5mph ≤ speed < 52.5mph |
| 12 | 55 | 52.5mph ≤ speed < 57.5mph |
| 13 | 60 | 57.5mph ≤ speed < 62.5mph |
| 14 | 65 | 62.5mph ≤ speed < 67.5mph |
| 15 | 70 | 67.5mph ≤ speed < 72.5mph |
| 16 | 75 | 72.5mph ≤ speed |
The following Table 2.12, “MOVES Pollutant Groups” provides a list of available MOVES pollutant groups that the user can specify to model within MOVES. The choice of pollutant groups(s) determines what pollutants are included in the three emission rate lookup tables (RPD, RPV, and RPP) output by MOVES. The letter 'X' marks the key pollutants for inclusion, and a letter 'd' signifies that the pollutant is included as a default in the MOVES run because a key pollutant depends on it. The user modifies the control.in input file to specify the pollutant group.
Table 2.12. MOVES Pollutant Groups
| pollutantID | pollutantName | Pollutant Group | |||
|---|---|---|---|---|---|
| Ozone | Toxics | PM | GHG | ||
| 1 | Total Gaseous Hydrocarbons | d | d | d | |
| 79 | Non-Methane Hydrocarbons | d | d | d | |
| 80 | Non-Methane Organic Gases | d | d | d | |
| 86 | Total Organic Gases | X | X | X | |
| 87 | Volatile Organic Compounds | X | X | X | |
| 2 | Carbon Monoxide (CO) | X | |||
| 3 | Oxides of Nitrogen | X | X | ||
| 30 | Ammonia (NH3) | X | |||
| 32 | Nitrogen Oxide | X | X | ||
| 33 | Nitrogen Dioxide | X | X | ||
| 31 | Sulfur Dioxide (SO2) | X | |||
| 100 | Primary Exhaust PM10 - Total | d | X | ||
| 101 | Primary PM10 - Organic Carbon | d | X | ||
| 102 | Primary PM10 - Elemental Carbon | d | X | ||
| 105 | Primary PM10 - Sulfate Particulate | d | X | ||
| 106 | Primary PM10 - Brakewear Particulate | X | |||
| 107 | Primary PM10 - Tirewear Particulate | X | |||
| 110 | Primary Exhaust PM2.5 - Total | X | |||
| 111 | Primary Exhaust PM2.5 - Organic Carbon | X | |||
| 112 | Primary Exhaust PM2.5 - Elemental Carbon | X | |||
| 115 | Primary Exhaust PM2.5 - Sulfate Particulate | X | |||
| 116 | Primary Exhaust PM2.5 - Brakewear Particulate | X | |||
| 117 | Primary Exhaust PM2.5 - Tirewear Particulate | X | |||
| 91 | Total Energy Consumption | d | d | X | |
| 92 | Petroleum Energy Consumption | X | |||
| 93 | Fossil Fuel Energy Consumption | X | |||
| 5 | Methane (CH4) | d | d | d | X |
| 6 | Nitrous Oxide (N2O) | X | |||
| 90 | Atmospheric CO2 | X | |||
| 98 | CO2 Equivalent | X | |||
| 20 | Benzene | X | X | ||
| 21 | Ethanol | ||||
| 22 | MTBE | X | |||
| 23 | Naphthalene | X | |||
| 24 | 1,3-Butadiene | X | |||
| 25 | Formaldehyde | X | |||
| 26 | Acetaldehyde | X | |||
| 27 | Acrolein | X | |||