In this tutorial, you’ll create and run a Project Future Year Inventory control strategy to project inventory emissions to a future year.
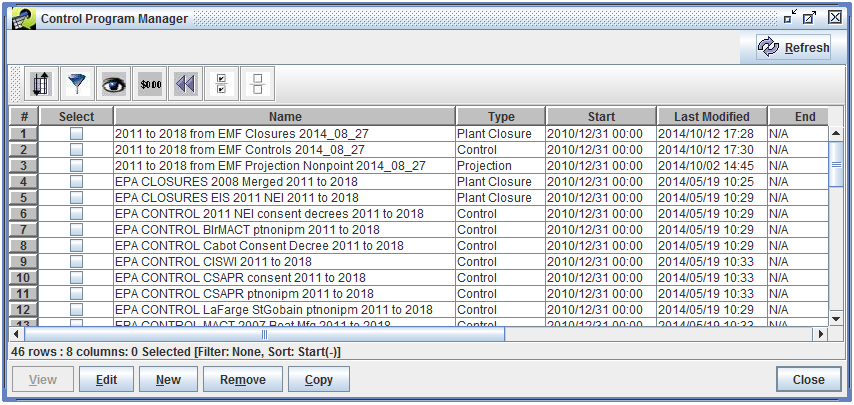
First, we’ll look at the various control programs that have been loaded into the MARAMA EMF system. From the main Manage menu, select Control Programs. The Control Program Manager window will appear, displaying the list of existing control programs.
Recall that there are four types of control programs:
The Type column in the Control Program Manager window shows the program type for each entry. Let’s take a look at a Plant Closure program. Find the Control Program named “EPA CLOSURES 2008 Merged 2011 to 2018”. Check the checkbox next to the name, then click the Edit button.
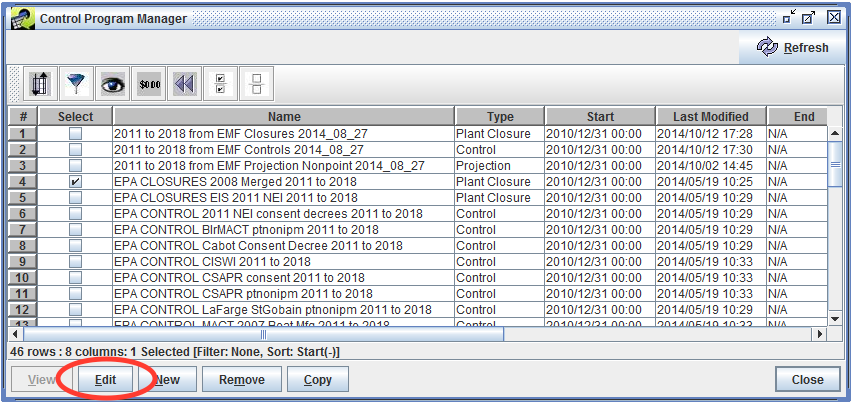
The Edit Control Program window opens, showing the information about the selected control program.
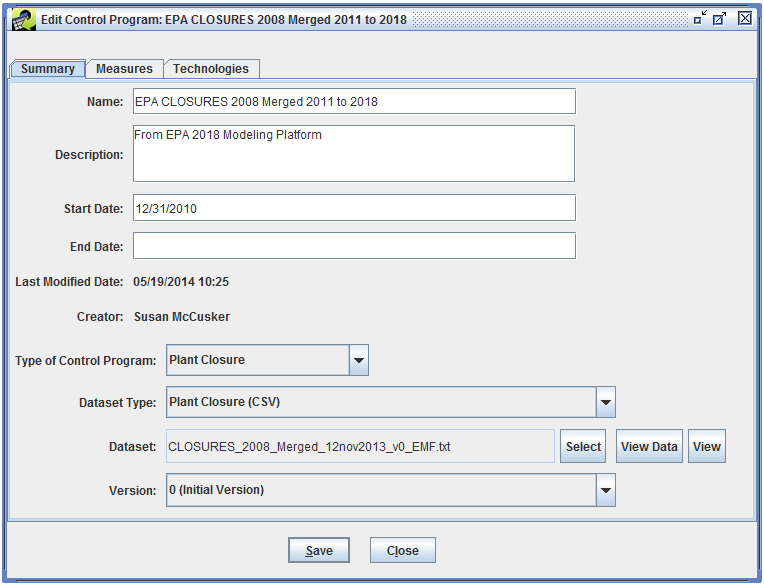
Every control program has an associated dataset which contains the details of the program. For Plant Closure programs, the associated dataset uses the dataset type “Plant Closure (CSV)”. For our selected control program, the specific dataset associated with the program is named “CLOSURES_2008_Merged_12nov2013_v0_EMF.txt”. Next, we’ll look at the details of this dataset.
Click the View Data button to the right of the Dataset name. This opens the Data Viewer, showing the raw data in the plant closure dataset. In the following screenshot, we’ve applied a row filter FIPS = '17203' to only show records where the FIPS code is 17203.
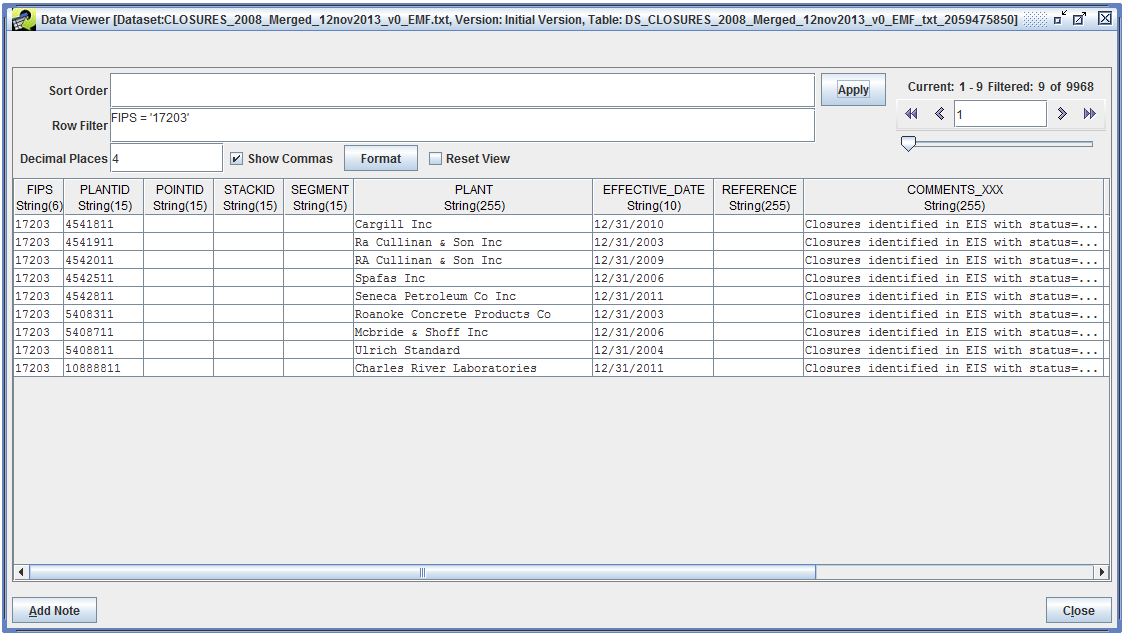
A plant closure dataset identifies specific plants to close. Each record consists of source information, like the region (FIPS code) and plant identification (PLANTID, POINTID, etc.), and the effective date for the plant closure. For example, the first line of the above screenshot identifies a plant in FIPS code 17203 (Woodford County, Illinois) with the plant ID 4541811. The PLANT column lists the plant’s name: “Cargill Inc”. This plant was closed as of December 31, 2010.
Next, we’ll look at a projection program. Return to the Control Program Manager and find the program named “EPA PROJECTION oil and gas 2011 to 2018”. Select it and click the Edit button to open up the Edit Control Program window.
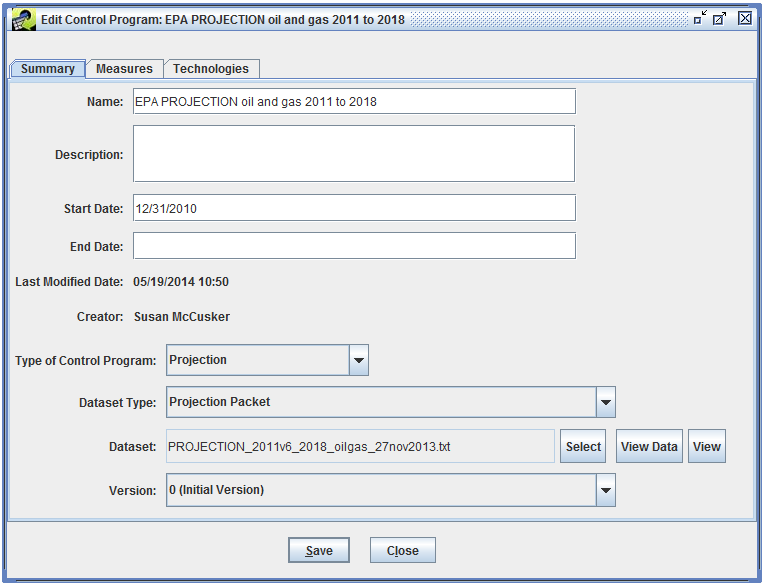
A projection control program is used to apply growth or reduction factors to inventory emissions. For this control program, the dataset type is “Projection Packet” and the specific dataset is “PROJECTION_2011v6_2018_oilgas_27nov2013.txt”. Click the View Data button to open up the Data Viewer.
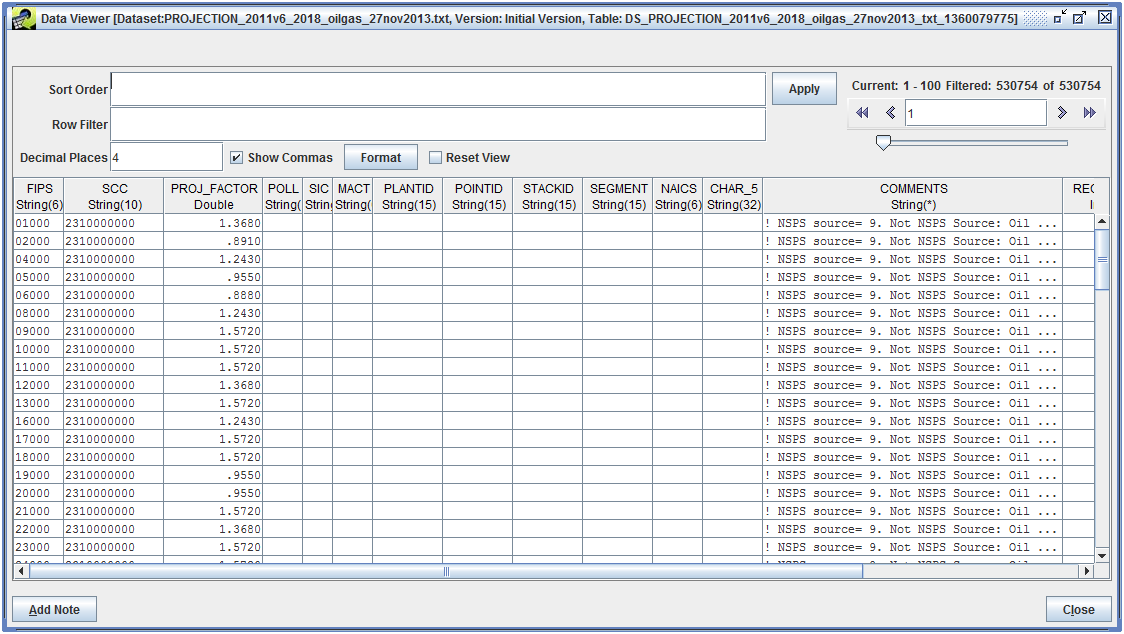
Each record in the projection dataset contains a projection factor (PROJ_FACTOR) and information about which sources the projection factor should be applied to. For example, the first line in the above screenshot lists FIPS code: 01000, SCC: 2310000000, and PROJ_FACTOR: 1.3680. This line will match inventory sources in state 01 (Alabama) where the SCC code = 2310000000. The emissions for the matched sources will be multiplied by the projection factor 1.3680. Since the projection factor is greater than 1, the emissions for the future year will be increased relative to the base year. Projection factors less than 1 indicate a reduction in future year emissions.
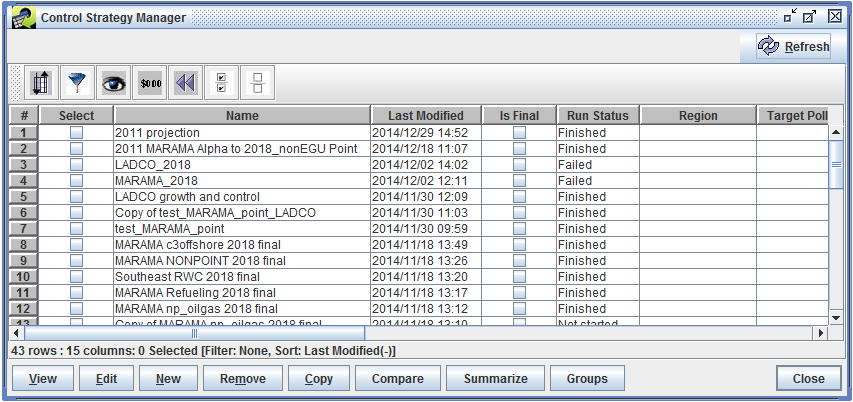
Now that we’ve looked at two different control programs - one implementing plant closures, and the other implementing emissions growth or reduction - we’ll create a simple control strategy to apply these control programs to an inventory. From the main Manage menu, select Control Strategies. This will open the Control Strategy Manager window listing existing control strategies.
Click the New button to start creating a new control strategy. In the window that opens, type a unique name for your control strategy like “2011 to 2018 ptegu - [your initials]”.
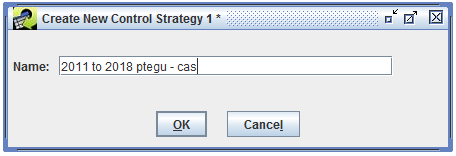
Click OK. The Edit Control Strategy window will open, ready for you to enter information about the new control strategy.
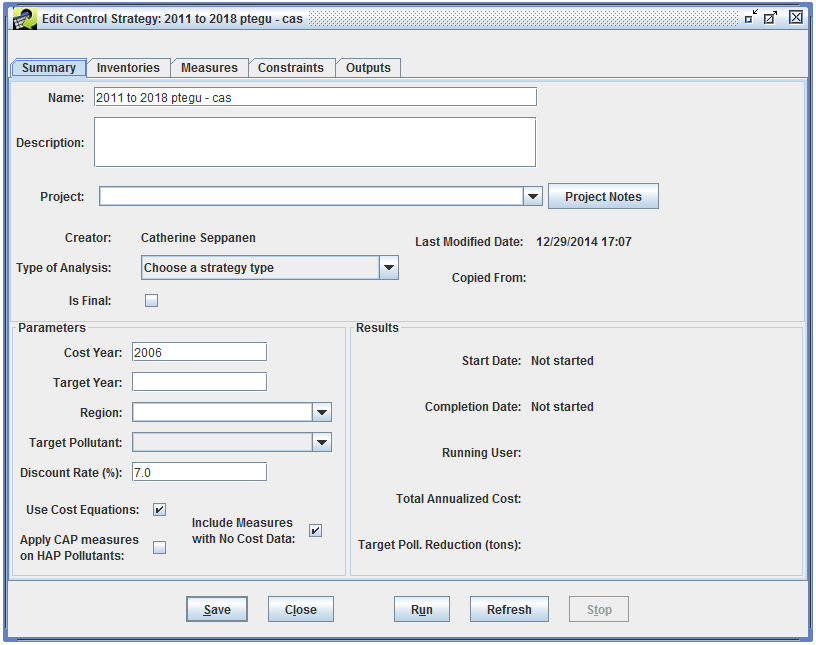
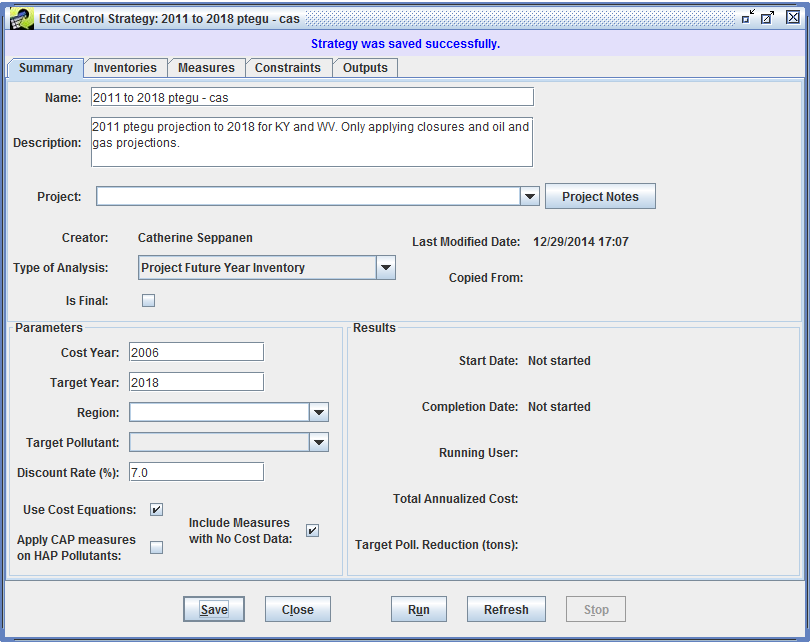
Using the Type of Analysis pull-down menu, set the strategy type to “Project Future Year Inventory”. You can optionally enter a description for the strategy, like:
2011 ptegu projection to 2018 for KY and WV. Only applying closures and oil and gas projections.
Set the Target Year to 2018. This is the year that the base year emissions will be projected to. After entering your strategy information, click the Save button to save your strategy.
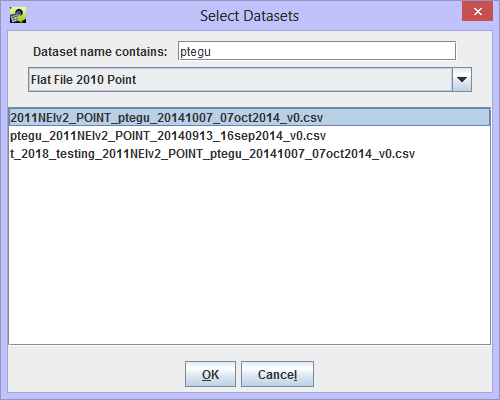
Switch to the Inventories tab to select the base year inventory to process. Initially, the list of inventories to process is empty. Click the Add button to bring up the Select Datasets window. Set the dataset type to Flat File 2010 Point and select the inventory named “2011NEIv2_POINT_ptegu_20141007_07oct2014_v0.csv”. You can enter “ptegu” in the Dataset name contains field to narrow down the list of inventories.
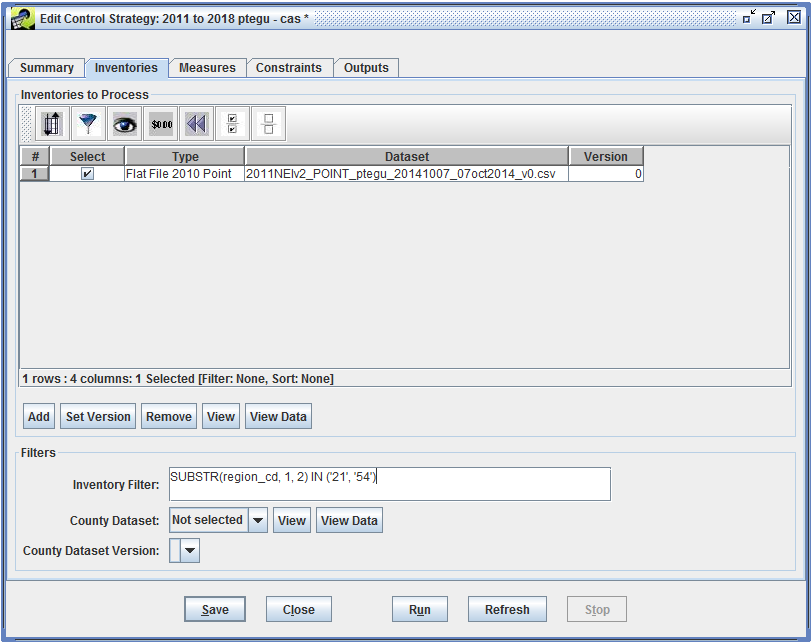
After selecting the inventory, click OK to return to the Inventories tab. For this tutorial, we’ll only consider two states from the inventory. In the Inventory Filter textbox, enter the following filter:
SUBSTR(region_cd, 1, 2) IN ('21', '54')
This filter will look at the first two characters of the region_cd column (i.e., the state portion of the FIPS code) and only match sources where the state code is 21 (Kentucky) or 54 (West Virginia).
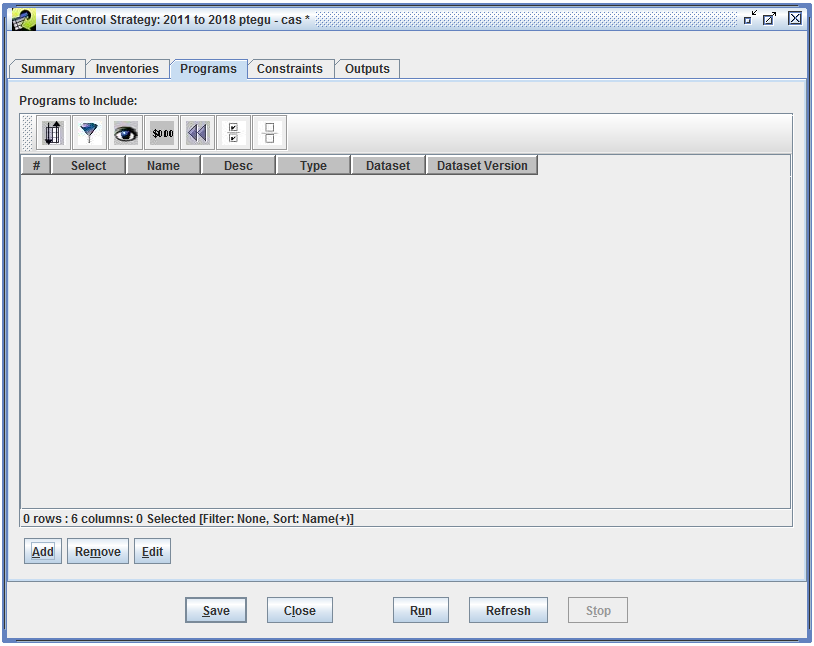
Switch to the Programs tab. If you see a tab labeled Measures instead of Programs, return to the Summary tab and check that the Type of Analysis is set to Project Future Year Inventory. If the analysis type is correct but you still don’t see the Programs tab, try switching the Type of Analysis to a different option and then back to Project Future Year Inventory. The Programs tab should initially look like the following:
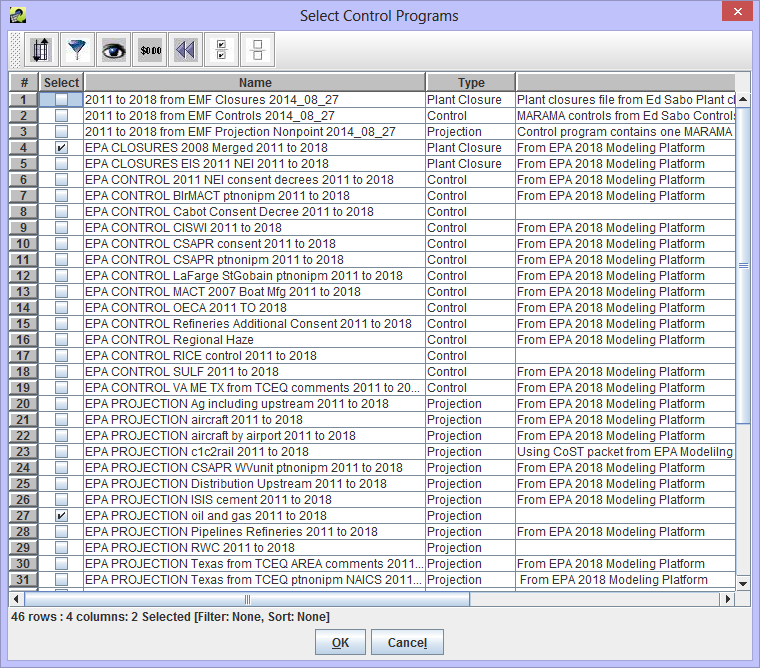
Click the Add button to select control programs to apply in this strategy. The Select Control Programs window will show a list of all the control programs available. For this tutorial exercise, select the two control programs we looked at previously:
EPA CLOSURES 2008 Merged 2011 to 2018
EPA PROJECTION oil and gas 2011 to 2018
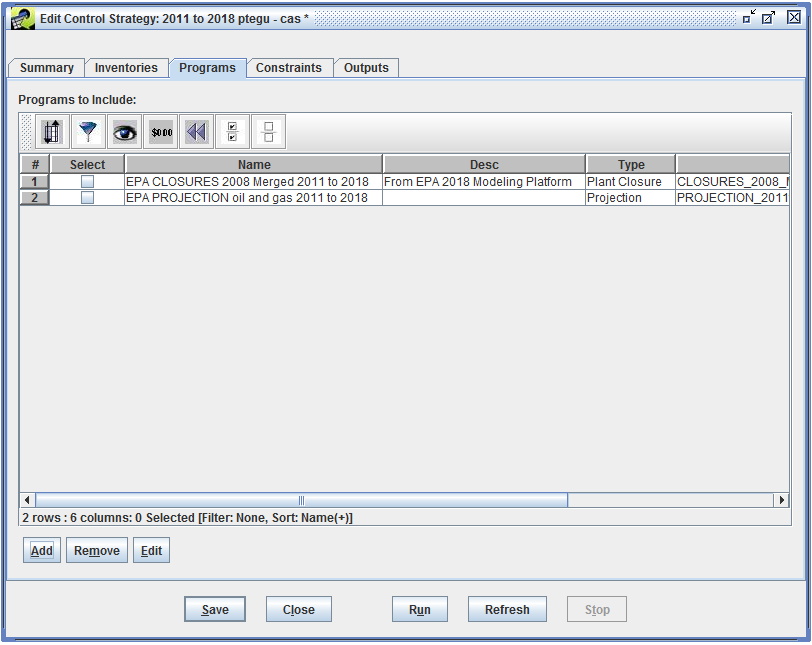
Click OK to return to the Programs tab. You should see the two control programs you selected listed in the Programs to Include section.
At this point, we’ve entered all the information we need for our strategy. Click the Save button to save your strategy.
From the Edit Control Strategy window, click the Run button to start running your control strategy. You’ll see a status message at the top of the window.
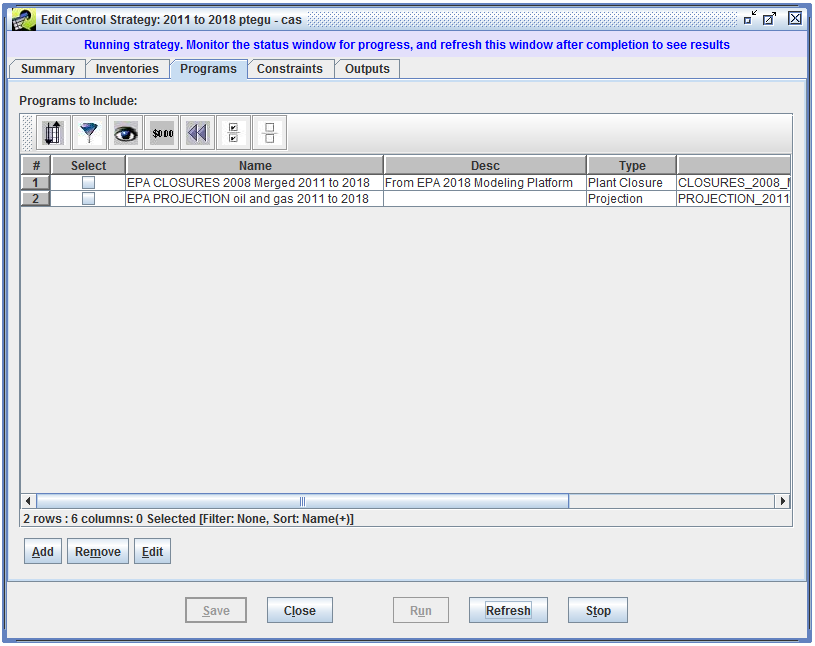
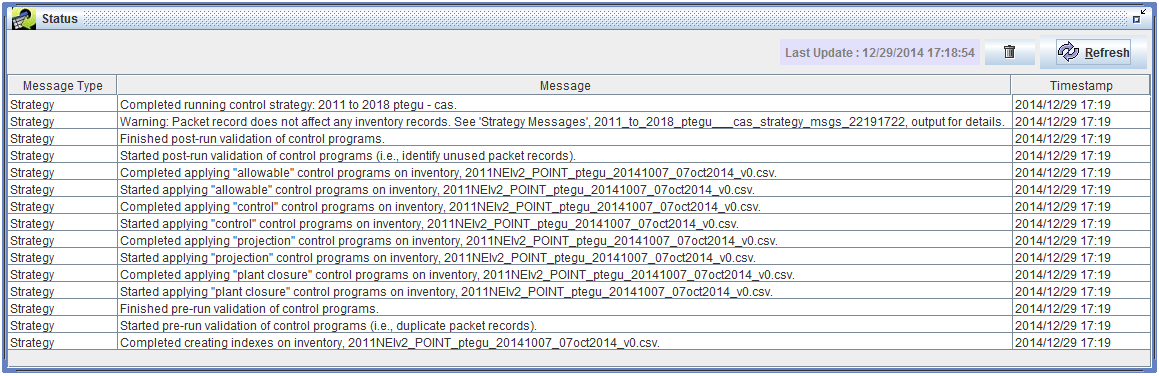
While the strategy is running, the Status Window will show various messages.
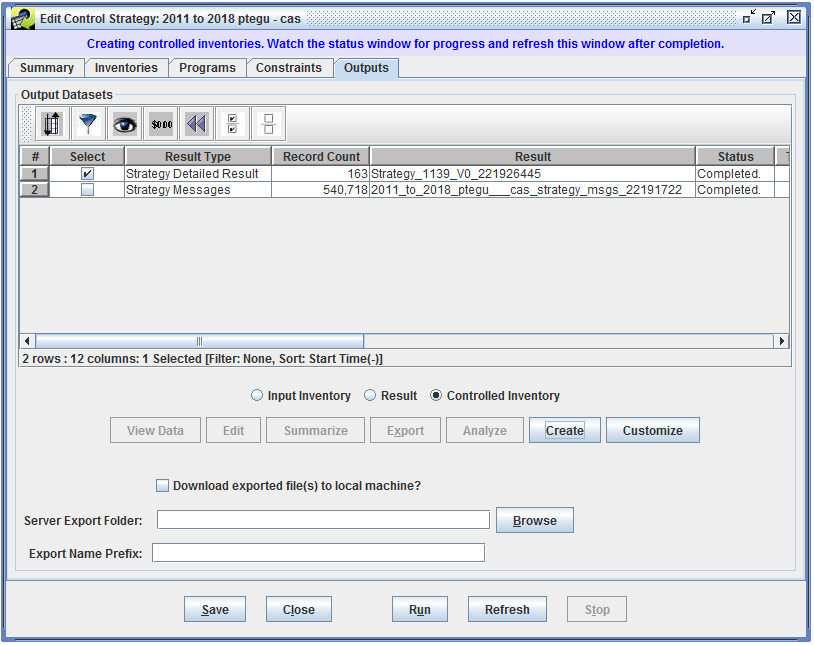
Once the run is complete, click the Refresh button in the Edit Control Strategy window and switch to the Outputs tab. You should see two output datasets created by the run.
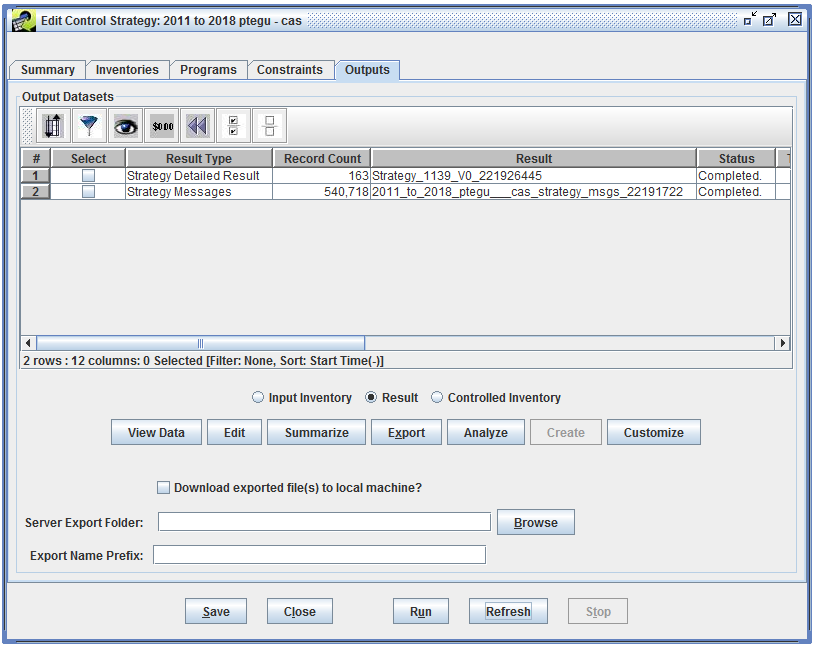
The Strategy Detailed Result dataset contains the details of how the control programs were matched and applied to the sources in the input inventory. The Strategy Messages dataset contains warnings and informational messages generated during the run.
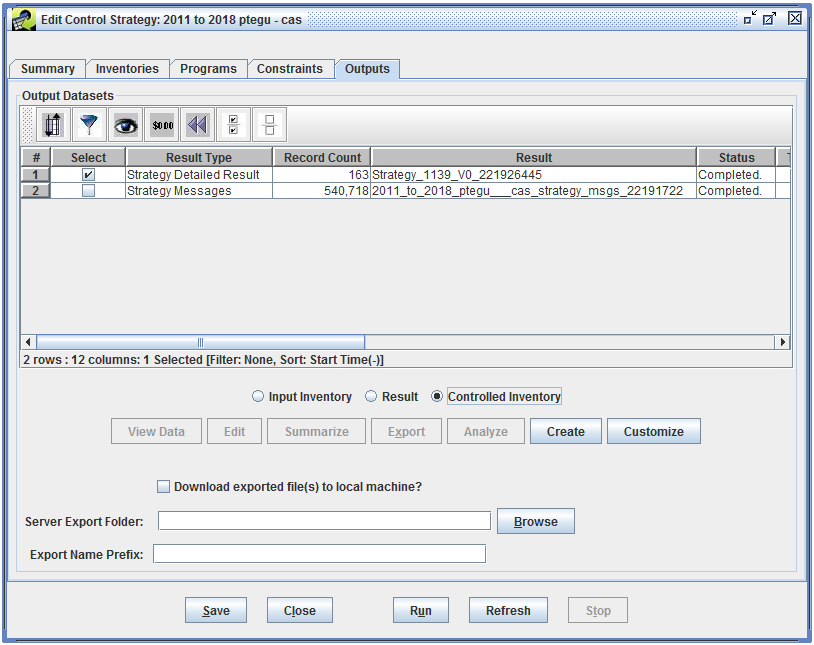
The Strategy Detailed Result dataset can be combined with the original input inventory to create a controlled/projected inventory. Check the checkbox next to the Strategy Detailed Result, and select the radio button labeled Controlled Inventory. The Create button should become active.
Click the Create button to start creating the controlled inventory. You’ll first be prompted to enter a prefix for the controlled inventory. Enter a prefix containing your initials like “2018_[initials]_”.
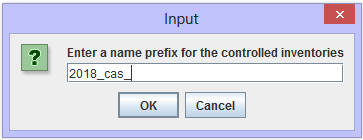
Click OK. You’ll see a status message printed at the top of the window.
Once the controlled inventory has been created, you’ll see a message like the following in the Status window:
Finished creating controlled inventories using control strategy ‘2011 to 2018 ptegu - cas’
In the Edit Control Strategy window, click the Refresh button to update the outputs list. Scroll the list of output datasets all the way to the right until you see the column Controlled Inventory. Your newly created inventory will be listed.
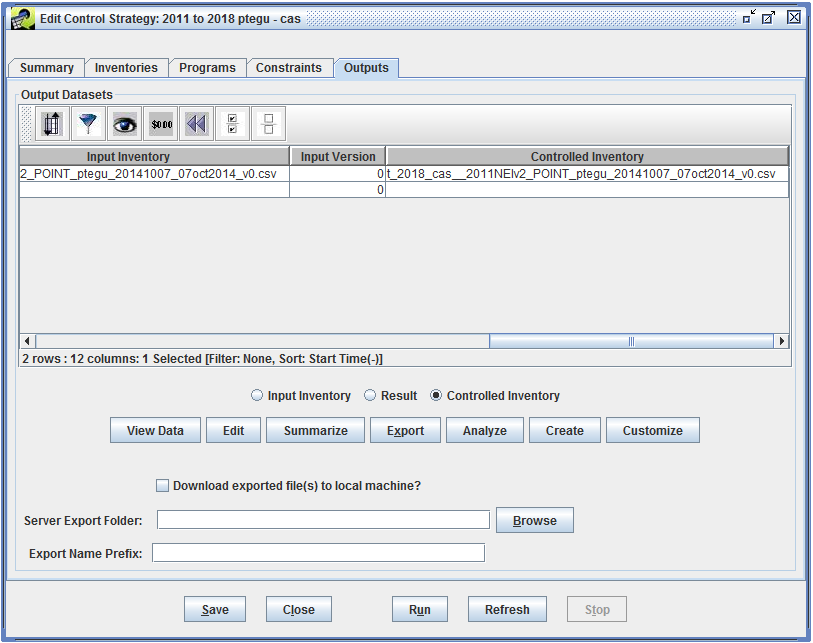
The controlled inventory is a dataset with the same dataset type as the input inventory. In this case, the dataset type is Flat File 2010. In the Outputs tab, make sure the radio button is set to Controlled Inventory, then click the View Data button. This will open up the Data Viewer window displaying the newly created inventory.
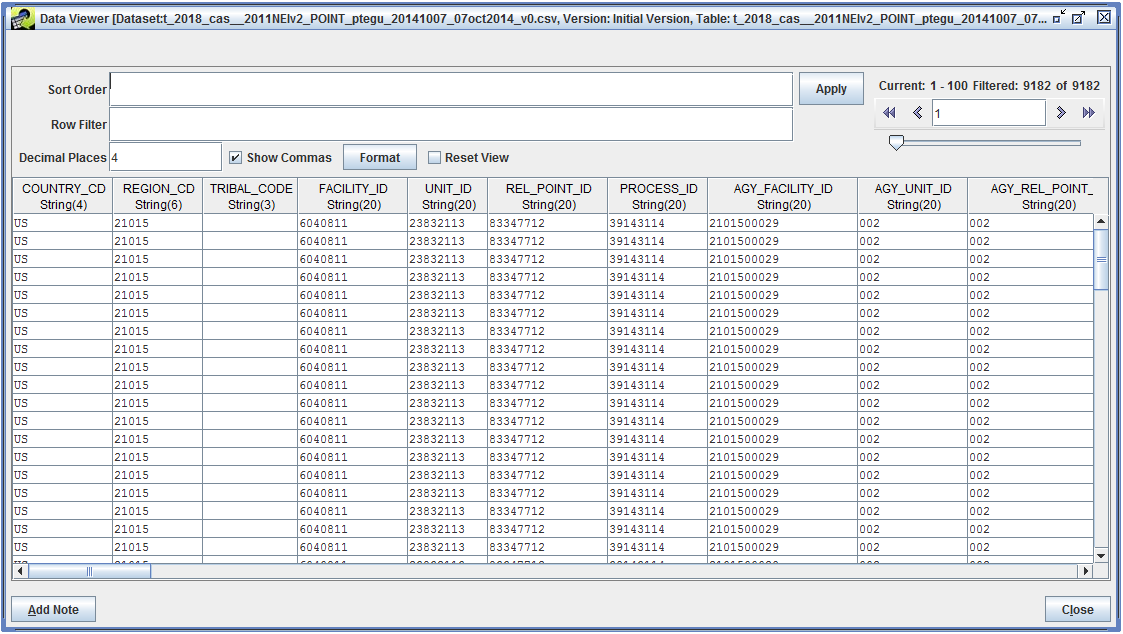
The controlled inventory contains the sources from the input inventory that were matched by our inventory filter. For this tutorial, we selected only Kentucky and West Virginia sources. For sources that had plant closures or projections (as detailed in the control programs), the impacts on the source emissions are reflected in the controlled inventory.
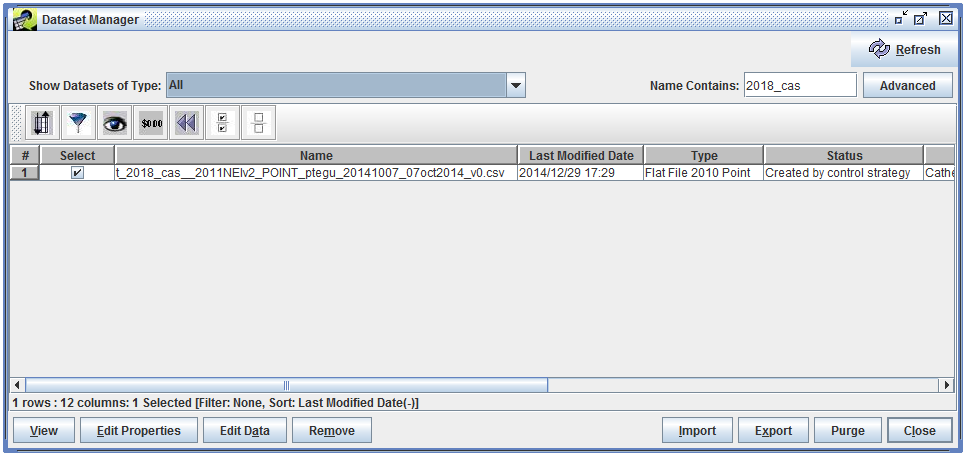
Since the controlled inventory is a dataset, you can also find it through the Dataset Manager. From the main Manage menu, select Datasets to open the Dataset Manager. In the following screenshot, we’ve used the Name Contains field to match datasets containing “2018_cas” (the prefix we entered for our controlled inventory).
In addition to creating a controlled inventory, you can directly analyze the Strategy Detailed Result created by the control strategy run. In this section, we’ll create a report summarizing the emission changes by control program, state, and pollutant.
In the Outputs tab of the Edit Control Strategy window, check the checkbox next to the Strategy Detailed Result dataset. Make sure the radio button next to Result is selected, then click the Summarize button.
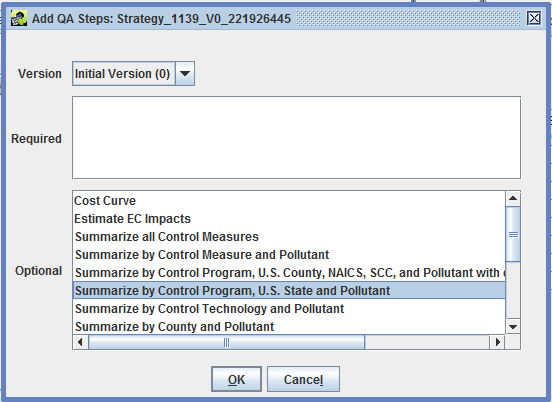
The Summarize button opens the QA tab of the Dataset Properties Editor for the Strategy Detailed Result dataset. In the QA tab, click the Add from Template button to bring up a list of available QA steps for this dataset type. Select the step named “Summarize by Control Program, U.S. State and Pollutant”.
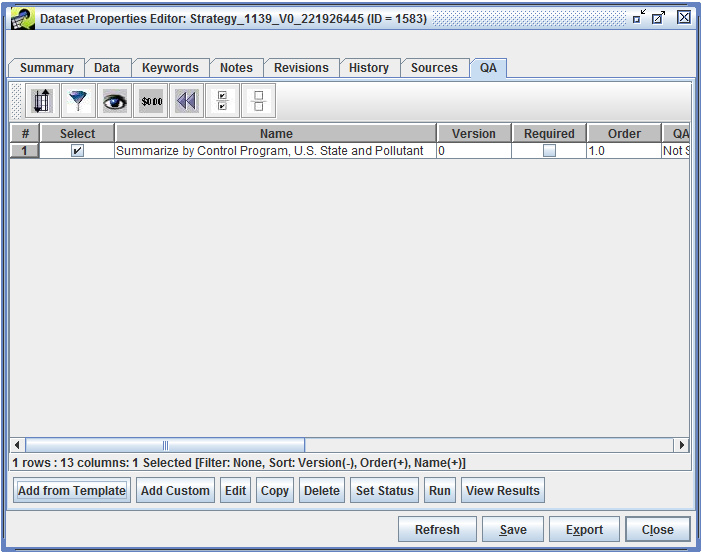
Click OK to add the QA step and return to the QA tab. You should see the new QA step listed.
Select the QA step and click the Run button to run the step. Once the step has finished, click the View Results button to open the results of the QA step.
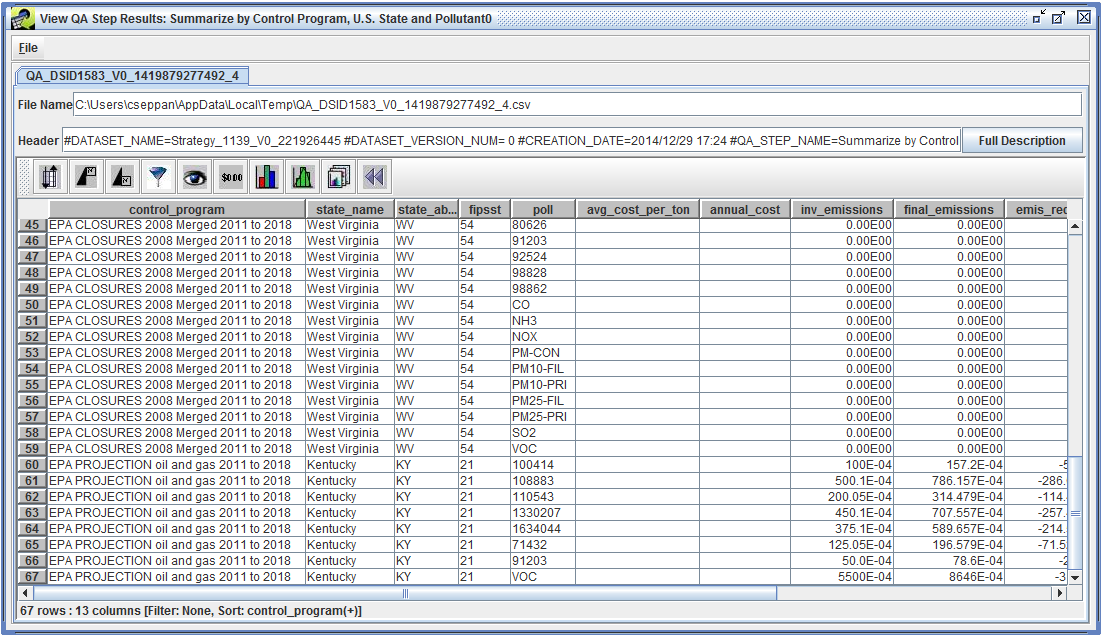
The QA step result lists each control program that was applied (in this run, we only applied two control programs). For each control program, there’s a breakdown by state and pollutant showing the inventory emissions and final emissions after applying the control programs.
This type of report can help you see which control programs apply to your inventory and the specific effects on inventory emissions. Remember that you can copy the SQL query from this QA step and modify it to create your own custom reports. For example, you might want county-level reports or reports broken down by SCC.
In this tutorial, you were introduced to the Project Future Year Inventory strategy in the EMF. We looked at two of the four types of control programs: plant closures and projection. We created a Project Future Year Inventory strategy for two states in a point source EGU inventory. After running the control strategy, we created a controlled inventory and looked at other options for analyzing the strategy output.